Using Quantity Indicator, you can visualize the quantities used in the design phase of a building so that you can track progress. You can switch between trade and material. After you have placed a component in the workspace, quantity indicator displays all the quantity details graphically. Any changes you make to this component update automatically. Of course, you can also update the data manually.
Quantity indicator
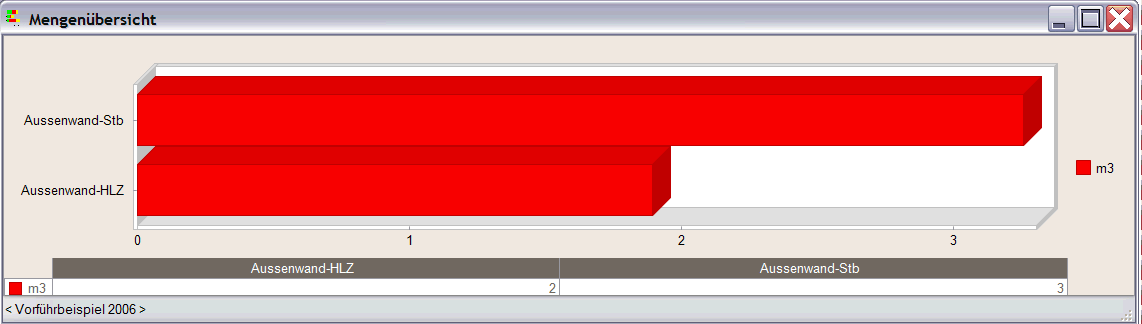
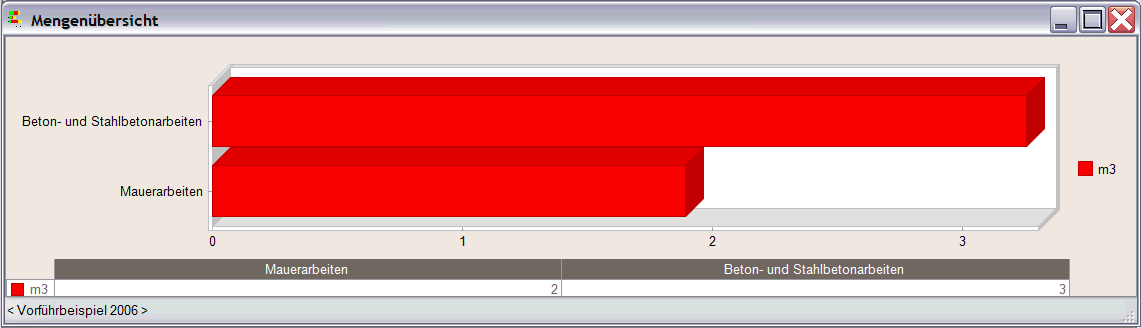
Quantity Indicator visualizes the quantities sorted by trade or material.
How to work with quantity indicator
To display quantity indicator, click ![]() Update Quantity Indicator (How). This tool also updates all the quantities. You can use
Update Quantity Indicator (How). This tool also updates all the quantities. You can use ![]() Automatic Quantity Indicator on/off (How) to specify whether data is updated automatically.
Automatic Quantity Indicator on/off (How) to specify whether data is updated automatically.
To work with and make settings in quantity indicator, you can use the shortcut menu or the toolbar, which you can show and hide at will. You can define the graphical appearance of tables and charts, choose colors, fronts, 2D or 3D. In addition, you can save your settings as templates, which you can retrieve at any time.

The quantity indicator window is always on top; that is, in front of the other ones, but you can minimize the window as usual in Windows.
You can filter similar elements by pointing to the elements in the “Quantity Overview” window. If, for example, you point to the calculation mode m3 in the legend or chart, all the other calculation modes will be hidden.
|
(C) ALLPLAN GmbH |
Privacy policy |